Within the National ClimateTech Program, the Israel Innovation Authority, the PLANETech innovation community and other partners have been driving actions to strengthen and grow technology innovation in climate-tech in order to diversify the high-tech industry and tackle global climate challenges.
The definition of ClimateTech is broad and has many interpretations, and so a clear definition for ClimateTech companies was required. After reviewing various definitions that were adopted in Israel and globally, we decided to formulate a new definition for ClimateTech that will serve as a synthesis of several existing definitions. This definition was based on in-depth technological and economic research and was approved by the Authority’s relevant stakeholders.
According to this definition, climate technologies consist of the following: technologies that directly and significantly reduce the flow of greenhouse gas (GHG) emissions to the atmosphere (mitigation), or that achieve adaptation to expected effects of climate change (“adaptation” and “tolerance”). This definition is based on a wide variety of information sources, such as the “ecosystem maps” of significant players in the Israeli high-tech industry (SNC, IVC, PLANETech, and the reports and definitions of other countries).
Classification by Technologies and Climate Challenges
This work was based on research that classifies Climate technologies into seven primary sectors and 24 subsectors. This classification is based on an independent study of each and every sector and subsector, which relied on various databases, studies and reports. Later, each subsector was subdivided into several main categories. Dictionary hierarchies and relevant keywords were created to practically classify companies into sectors, subsectors and categories. The list of sectors and subsectors and descriptive statistical data that depict them are at the end of this appendix.
Moreover, to achieve consistency with previous reports, a systematic approach was used to identify the correlation of every company to the PLANETech “Climate Challenge Map,” such that each company was essentially classified under one or more technological subsectors and under one climate challenge.
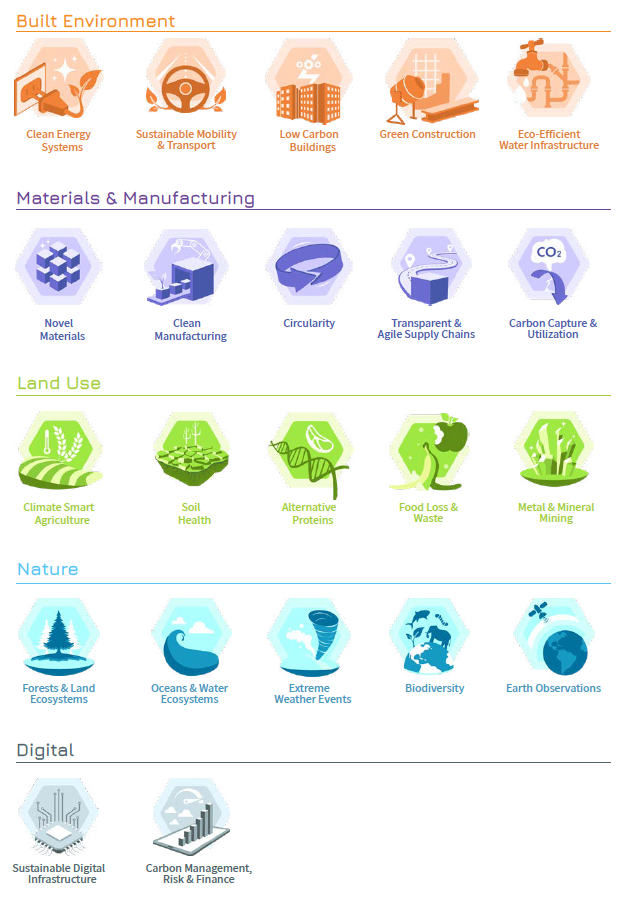
PLANETech’s Climate Challenge Map identifies the main challenges involved in greenhouse gas mitigation or climate change adaptation under five “fields.”
1. Built
Environment
Includes buildings, the spaces, passages, and landscapes between them, and the above and below ground infrastructure that supports human activity such as transportation networks and utilities (e.g., water, energy, telecommunications)
2. Materials and
Manufacturing
Innovations across the whole life cycle and value chain of materials and products we make and use. Advances in primary materials, intermediate and end products, manufacturing processes and supply chains
3. Land Use
Restoring soil health, preventing land degradation, and reducing emissions that result from human land-use driven by agriculture, production and consumption
4. Nature
Conserving and restoring natural ecosystems to enhance carbon sinks, protect biodiversity, and strengthen the resilience of habitats and species
5. Digital
Digital infrastructure solutions that reduce the resource consumption of digital services and infrastructure, platforms that support climate reporting and risk assessment
The aforementioned five pillars include 22 specific categories, which are presented at the end of this chapter.
Classification process
To classify Israeli high-tech companies under those categories and identify climate tech companies, the keywords that appear in the various dictionaries were cross-referenced with the IVC database. Following this cross-reference process, approximately 1600 companies were identified that are involved in operations assigned to one of the defined climate sectors. To assess the affinity of a company’s operations to climate categories, AI-based analysis was conducted, cross-referencing and assessing the extent of that affinity between the identified climate tech companies and the various climate challenges mapped by PLANETech, which are in line with SDG objectives. Companies whose affinity to one of the climate challenges exceeded a certain threshold were labeled as “Climate Core Companies.” The number of companies that met this condition was 642.
Later, climate companies whose maximum score with respect to climate challenges was lower than the threshold, indicating an indirect effect on climate challenges, were reviewed. This process was conducted manually and resulted with 211 additional companies that were classified as climate tech companies.
Moreover, to maintain consistency with previous reports, an analysis that compared the group of 1600 initial companies identified in this process and the group of companies identified in the framework of previous reports, resulting in additional 93 companies that were classified as climate tech companies.
In total, 946 active climate tech companies have been identified in Israel in 2024. The following table presents the distribution of companies to sectors and subsectors, as well as several indicators that describe the activity in each subsector. It should be emphasized that a company may be classified in more than one sector, to explain the total number of companies in the table exceeding the total number of companies, 946. Accordingly, the total fundraising amount without duplications was 614 million USD in 2024, and 276.3 million USD in early stages (up to Series A, inclusive) only1It should be noted that 22 companies do not appear in the IVC database, and there is therefore no available funding data that describes them. Moreover, in the process of incorporating previous reports, 25 companies were identified that could not be classified under any sector. These companies are not included among the active companies depicted in this table, but their funding rounds are included in the total because they are ascribed to one of the climate challenges..
As stated, a primary climate challenge was assigned to each climate tech company. This classification was achieved by means of the above-described AI tool and by way of a manual review of certain companies identified in the framework of processing previous climate reports.
TABLE 1 | Climate Tech Primary Sectors and Subsectors
| Sector | Subsector | Number of active companies | Number of companies established in 20242These numbers are expected to rise over the next two years because the identification and classification of new companies can sometimes be delayed. | Total capital raised in 2024, usd millions | Total fundraising in early stages (up to series a,(inclusive) in 2024, usd millions |
|---|---|---|---|---|---|
| Energy | Alternative Fuels | 55 | – | 4.4 | 0.6 |
| Energy | Energy Management | 108 | – | 255 | 89.5 |
| Energy | Renewable Energy | 110 | – | 30 | 12 |
| Energy | Energy Storage | 63 | – | 26.2 | 0.6 |
| Construction | Green Construction | 66 | – | 234 | 75 |
| Construction | Building Materials | 29 | – | 25 | 0.5 |
| Construction | Urban Tech | 76 | 1 | 1.5 | 13 |
| Transportation | Electric Transportation | 61 | 1 | 98 | 32.4 |
| Transportation | Transport Optimization | 93 | – | 249 | 47 |
| Transportation | Alternative Transportation | 37 | – | 2.35 | 27 |
| Waste technologies | Waste management | 26 | – | 0 | 0 |
| Waste technologies | Waste Mechanical Processing | 31 | – | 0 | 0 |
| Waste technologies | Waste Treatment | 59 | – | 12 | 2 |
| Manufacturing | Smart manufacturing | 51 | – | 169 | 20 |
| Manufacturing | Novel Materials | 60 | – | 22.3 | 14.5 |
| Environmental Services & Technology | Environmental Protection | 55 | – | 9 | 9 |
| Environmental Services & Technology | Financials in Climate Action | 21 | 1 | 9 | 9 |
| Environmental Services & Technology | CCUS Technology | 19 | – | 9.2 | 9.2 |
| Environmental Services & Technology | GHG Management & Monitoring | 11 | – | 1.6 | 1.6 |
| Agriculture | Agriculture Biotech | 112 | – | 33.6 | 33.6 |
| Agriculture | Food technology | 172 | 5 | 62.8 | 61.5 |
| Agriculture | Precision Agriculture | 134 | 1 | 87.2 | 68.2 |
| Agriculture | Water technology | 128 | 1 | 15.2 | 2.7 |
| Agriculture | Indoor & Urban Agriculture | 79 | – | 19.3 | 17 |
The report’s methodology is based on an innovative technological classification process that employs artificial intelligence and various tools such as the “Climate Challenge Map” and “Market Square”. This methodology provides a comprehensive framework that maps and facilitates climate innovation, and it presents an in-depth overview of the Israeli climate tech industry. Despite the effort to map climate tech companies, investments, and entrepreneurial activity in this industry, some ventures may exist that either act covertly or that have yet to make their operations public, and they are therefore not included in this report.
FIGURE 1 | PLANETech Climate Challenge Map