The Israeli high-tech industry is dynamic and constantly changing. What happened to the High-Tech Index, what are the prominent financing trends, and which regulatory changes were introduced? Developments in high-tech 2016-2017
The High-Tech Industry in Israel – The Surge Continues
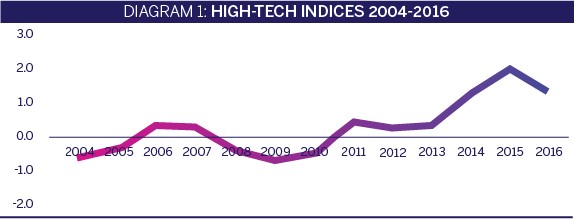
In 2015, we were witness to the peak of the Israeli high-tech industry’s performance, as was reflected by the Innovation Authority’s High-Tech Index (see below). In 2016, the high level of performance has been maintained, although a slight decline has been recorded in several indicators, expressed in both the Start-Up Companies Sub-Index and in the Mature Companies Sub-Index. This raises a question – does this level reflect the glass ceiling of high-tech performance given its present limitations (mainly the shortage of skilled labor)? Alongside a discussion of the industry’s performance during the years 2015-2016 as reflected by the various weighted indicators in the High-Tech Index, in this section we will also present initial indicators of high-tech performance in 2017.
What is the High-Tech Index?
The High-Tech Index is a synthetic index created by the Innovation Authority’s Strategy and Economy Division. The index is intended to reflect the different levels of activity in the Israeli high-tech industry. The index is divided into two sub-indices: The Startup Companies Sub-Index and the Mature Companies Sub-Index, out of an understanding of the fundamental differences between the large mature companies and the startup companies operating in the local market (for more details on the indicators comprising the index and their values throughout the period of their use, see the appendix to this chapter). The cumulative result of the index itself incorporates a weighted calculation of these two sub-indices.
This year, with the cooperation of Prof. Camil Fuchs, the methodology used for calculating the index was revised. The main adjustments are surveyed in depth in the methodology appendix that can be found on the Authority’s website under Strategy and Economy Division Publications.
http://economy.gov.il/RnD/Documents/HiTechIndex.pdf
As we did in previous years, in discussing the high-tech industry, we are continuing to distinguish between two groups: the startup companies group and the group of mature companies. In the group of startup companies, we saw a continuation of the positive and consistent trend that began with the end of the global financial crisis, even if at a slightly lower level than the peak of last year (See Diagram 2).

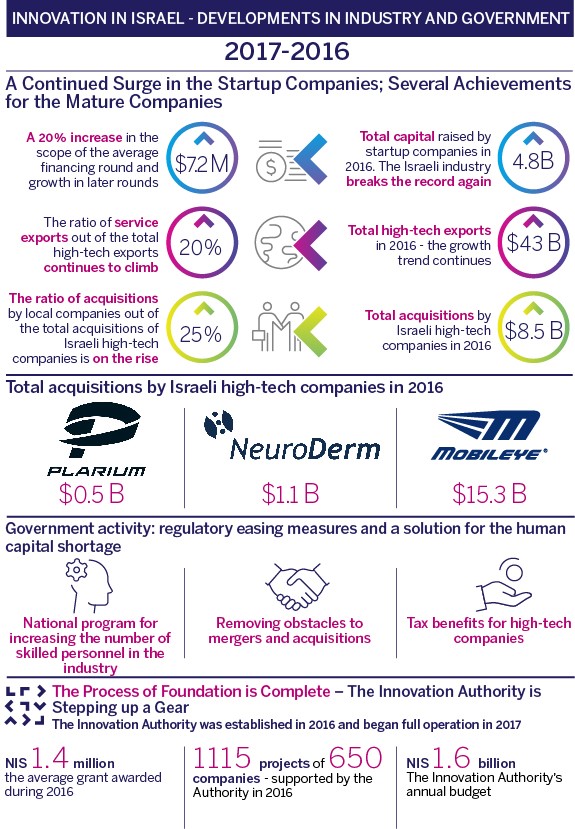
The large scope of funds raised by high-tech companies had a significant influence on this result. According to the IVC Research Center, approximately USD 4.8 billion flowed into the companies’ cash reserves, a figure that constitutes a new Israeli yearly record. This is while in the United States, venture capital investment actually declined for the first time after five consecutive years of growth. Furthermore, the financing rounds themselves were larger than normal: the average round stood at approximately USD 7.2 million, some 20 percent more than the average during the previous five years. Specifically, the average round in advanced stages1. grew from approximately USD 20 million in 2015 to USD 25 million in 2016.2
2017 commenced at a similar pace with USD 2.3 billion being raised during the first half of the year, 75 percent of which was in mid-stage and late-stage deals (all with a scope of at least USD 10 million per transaction).3 These results apparently testify both to the maturity and readiness of the Israeli companies and also to higher investor willingness than in the past to become involved in follow-up investments at later stages.
A slight decline in relation to 2015 was registered in the net addition of new startup companies (companies opened less those closed), but it should be mentioned that a net increase of more than 600 companies to the total number of start-up companies is a significant addition of which many countries would be proud.
The scope of ‘exits’ during 2016 was slightly lower than in previous years, however it is important to mention that consensus regarding this figure is not universal, specifically concerning the definition of an “Israeli exit”.4 Nevertheless, the scope of exits may yet reach a new record in 2017, this in light of several huge deals that have been completed this year: the closing of the Mobileye sale to Intel for the sum of USD 15.3 billion;5 the sale of NeuroDerm, that had enjoyed the support of the Innovation Authority since inception, to the Mitsubishi Corporation for USD 1.1 billion, and the sale of Plarium to the Australian company Aristocrat for USD 500 million. This figure testifies again to the attractiveness and high technological level of the Israeli startup companies but also presents a policy challenge – how to retain more of the fruits of Israeli high-tech in Israel when the technology giants are eager to acquire Israeli technology in its early stages. This issue is discussed in the chapter on the Innovation Authority’s strategy in this report.
One huge ‘exit’ that stood out during 2017 expresses the unrealized potential within the Israeli pharmaceutical industry. The Kite Pharma Corporation, with products based on technology developed at the Weizmann Institute, was recently sold for USD 12 billion to the American corporation Gilead. Although Kite Pharma was initiated at the Weizmann Institute and is headed by an Israeli, its entire operations are conducted in the United States where it is registered. Furthermore, the majority of its investors and employees are American. The State of Israel will therefore benefit from only a tiny portion of the economic profit of Israeli-developed technology.
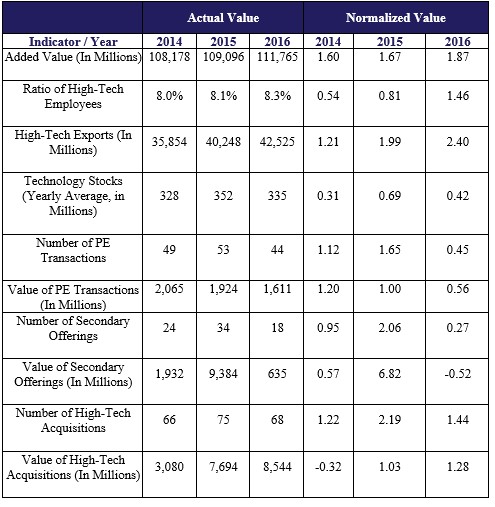
The mature companies group displayed a similar picture i.e., positive performance but lower than that of 2015,6 a fact expressed in the decline of the relevant sub-index (see Diagram 3)
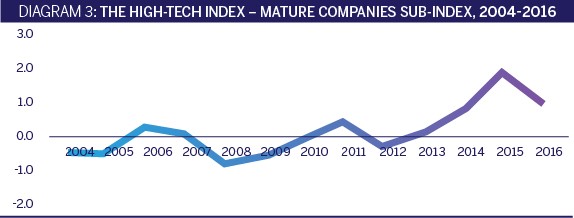
In 2015, almost all the indicators comprising the Mature Companies Sub-Index rose with noticeable increases in the total value of acquisitions made by Israeli high-tech companies7. and the total of secondary issues of Israeli companies.8These issues served, among others, to finance these same acquisitions. During 2016, most of the sub-index’s indicators showed a decline as could be expected following a record year and yet, a number of indicators reflect important achievements. Specifically, the total acquisitions made by Israeli companies continued to climb and reached USD 8.5 billion;9 . the ratio of high-tech employees out of the total employees in all sectors returned to the previous record level – 8.3 percent – at which it stood on the eve of the 2008 crisis;10 and total high-tech exports reached a record level of approximately USD 43 billion, reflecting an increase of approximately 5 percent (see Diagram 4).11
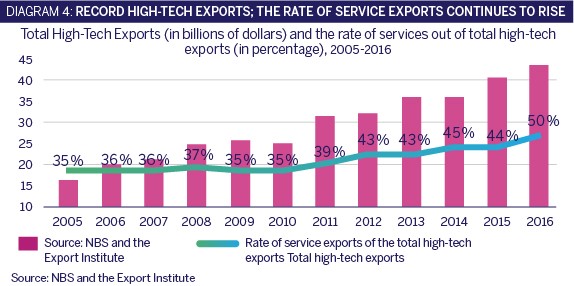
The increase in high-tech exports stems entirely from a growth of approximately 20 percent in service exports (that includes mainly computer and software services, R&D services, communications and others). Industrial exports, on the other hand, dropped by approximately 6 percent. The trend of change in the composition of high-tech exports and the diversion of focus from manufacture to services, is expected to continue in coming years, as is already reflected by the results for the first half of 201712.cause for concern is the recent weakness of the TEVA Corporation that may negatively affect the total Israeli exports as well as the Tel Aviv Stock Exchange.
APPENDIX – RESULTS OF INDICATORS COMPRISING THE HIGH-TECH INDEX
The Startup Companies Sub-Index
- Net New Companies: The sub-index represents the net change in the number of Israeli companies operating in the high-tech industry. In other words, subtracting the number of Israeli high-tech companies that were closed from the number of Israeli high-tech companies that were established. It should be mentioned that the figure for 2016 is not final and is based on IVC estimations.
- Amount and Value of Capital Raised by Companies: The total value and number of financing transactions in which Israeli high-tech companies raised capital from all investors – venture capital funds, angels and other investors.
- Number and Value of Exits: The monetary value of, and number of exits in which the Israeli high-tech companies participated. An exit is defined both as an initial offering (IPO) and a merger or acquisition (M&A).
Capital raised by VC Funds: The indicator totalizes the total capital raised by Israeli venture capital funds in a year. The figure constitutes an indication of the expected future investments of those same funds in Israel.

Mature Companies Sub-Index
- Added Value: Defined as the difference between the gross output and total input. The sub-index is calculated as the sum of the added value, both in high-tech manufacturing and in high-tech services (the computer and software sector and the R&D services sector which includes startup companies).
- High-Tech Exports: The total exports of the high-tech sectors in manufacturing and services including that of the startup companies.
- Ratio of Salaried High-Tech Employees: Ratio of high-tech employees, excluding employees in the communications services sector, out of the total employees in all sectors.
- Technology Stocks: The Tel Aviv Blue-Tech 50 Index, that includes the 50 shares with the highest market value of all the shares included in the TA Technology Index and the TA Biomed Index. The figure is calculated as an average of the daily closing indices, for each year.
- Number and Value of PE Transactions: PE financing includes bridging loans, financing via sale of shares, Buyout and mezzanine loans by Israeli high-tech companies.
- Number and Value of Secondary Offerings: Number and value of the rounds of public financing undertaken by Israeli high-tech companies whose securities are already registered for trade (secondary offerings). This variable represents the continued growth of Israeli public companies.
- Value and Amount of High-Tech Acquisitions: The total sum of all merger and acquisition transactions executed by Israeli high-tech companies, while the acquired company is not necessarily Israeli or technological.
- Series B and onwards. ↩︎
- Geektime (January 2017). Annual Report 2016: Startups and Venture Capital in Israel. Link: http://www.geektime.co.il/wp-content/uploads/2017/01/Geektime-report_po… ↩︎
- IVC figures ↩︎
- IVC reported on a total of USD 10 billion in 2016 while PWC reported only USD 3.5 billion. The difference stems from disagreement regarding the inclusion of the Playtika acquisition by a Chinese consortium and with the participation of the gaming corporation Giant Interactive, from the previous owners Caesars Interactive Entertainment who were also not Israeli. For the purpose of calculating the index, use was made of the IVC figures without the Playtika transaction. ↩︎
- Mobileye had already evolved from the startup to developed company stage prior to the acquisition. Accordingly, it can be said that this deal should be considered a merger and not an ‘exit’ ↩︎
- The 2016 Innovation Report presented only a partial picture regarding 2015 for the Mature Companies Sub-Index. ↩︎
- USD 7.7 billion, after disregarding the Teva-Allergan deal. ↩︎
- USD 9.4 billion, compared with the previous high of USD 3.5 billion. ↩︎
- According to Start-up Nation Central figures, 24 percent of all acquisitions of Israeli high-tech companies in 2016 were made by local companies. ↩︎
- Calculated after adaptation of NBS data by the Strategy and Economic Division of the Innovation Authority. The adaptation included revaluation and historic adjustment of all salaried employees by retroactively adding the number of salaried employees in the I.D.F. (regular and permanent service) including before 2012 (the year in which the NBS began publishing the total figure). ↩︎
- According to a combination of data from the Export Institute (for service exports) and the NBS (for industrial exports). ↩︎
- The Trends and Developments in Exports Report – First Half 2017, The Economic Division of the Export institute ↩︎