Appendix 1 – Main Differences Between the Approaches
The information presented in this report presents two different approaches regarding the definition of the hightech sector. The first is based on the international definition as presented by the CBS in its publications (“the hightech sector”), while the second (“the high-tech companies”) is based on the companies’ databases of SNC and IVC. Administrative data is used for both definitions. In the case of the “high-tech sector” definition, the administrative data includes all high-tech employees in Israel, it is gathered by the Tax Authority, and received from the CBS. For the “high-tech companies” definition, the data was extracted from the state data processing unit (Shaam) and was analyzed by the Chief Economist Division in the Ministry of Finance. The table below presents the updated figures for each definition.1Further information on the different high-tech definitions was published in the report of the “Committee for improving the high-tech data infrastructure in Israel” convened by the CBS.
| Index | High-tech sector definition (2021, excluding communications) | High-tech companies definition (2020) |
|---|---|---|
| Number of companies | 13,837 | 8,144* (6,980 companies that reported employing workers, turnover or a profit) |
| Number of full-time salaried employee jobs (thousands) | 284.9 | 255 |
| Number of foreign companies | 309 | 552 (527 companies that reported employing workers, turnover or a profit) |
| Number of salaried employees in foreign companies (thousands) | 58.8 | 68 |
| Average salary for a full-time job (monthly, NIS) | 26,544 | 27,407 |
| Total revenues from income tax on high-tech employees’ salaries (NIS millions) | 21,781 (23,810 including capital gains tax) | 19,626 (21,379 including capital gains tax) |
| Average income tax per fulltime job (monthly, NIS) | 6,372 (6,966 including capital gains tax) | 6,409 (6,983 including capital gains tax) |
| Full-time job definition** | Salaried employees in job types 1-3 according to Income Tax classification, calculated monthly, weighted by the no. of months a year in high-tech employment | Salaried employees in job types 1-3 according to Income Tax classification, calculated monthly, weighted by the no. of months a year in high-tech employment |
| Foreign company definition | Based on data from the Businesses Registrar for the foreign owned sector. The data is based on an algorithm that combines the business’s ID no. and information received from surveys of the various businesses conducted by the CBS (e.g., a globalization survey) | Foreign company according to IVC – a global company with R&D activity in Israel, company headquarters overseas, foreign ownership. Foreign company according to SNC – a company founded overseas, with its headquarters overseas, and a division/ activity in Israel |
* The high-tech companies definition: the companies were defined according to criteria of external databases – IVC and SNC. Added to this are companies not included under this definition, but which were eligible for tax benefits under the technology track and were included in the high-tech companies database. A high-tech company according to IVC – the company’s headquarters are located in Israel, local R&D activity, senior Israeli management, and received funding from an Israeli entity. A high-tech company according to SNC – the company develops technology/intellectual property, has an office in Israel, local R&D activity, and at least one of the founders is Israeli.
**The two definitions lead to different results in relation to frequently published data about high-tech and is primarily based on the CBS human capital survey. The 2020 survey data indicates approximately 340,000 salaried employees who constitute about 10% of salaried employees that year, compared to 7.5% according to the high-tech companies definition, that is calculated with a different database (administrative data). These differences stem primarily from differences in the period used to define a job/employee: while administrative data calculates jobs on a yearly basis, the human capital survey operates on a monthly basis. In the classification according to high-tech companies, a salaried employee’s job is defined for the relative period of high-tech employment during 12 full months in a calendar year. For example, if in 2019 an employee was reported to have worked for 6 months in high-tech companies and then moved to a field not defined as high-tech, the job will be calculated only for the relative part of the calendar year (6/12). For more information, see a comparative analysis of employment and salary indices between different sources published by the CBS.
Appendix 2 – State Revenues from Individuals and Companies, 2019
The distribution of state revenues from taxation in 2019 is similar to that of 2020 as presented in this report, despite the influences of the Covid crisis.
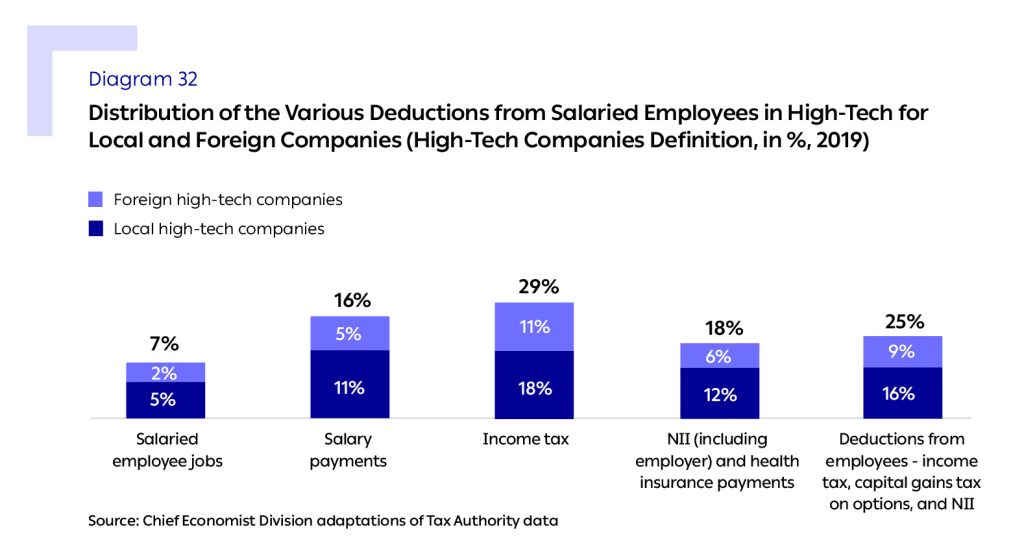
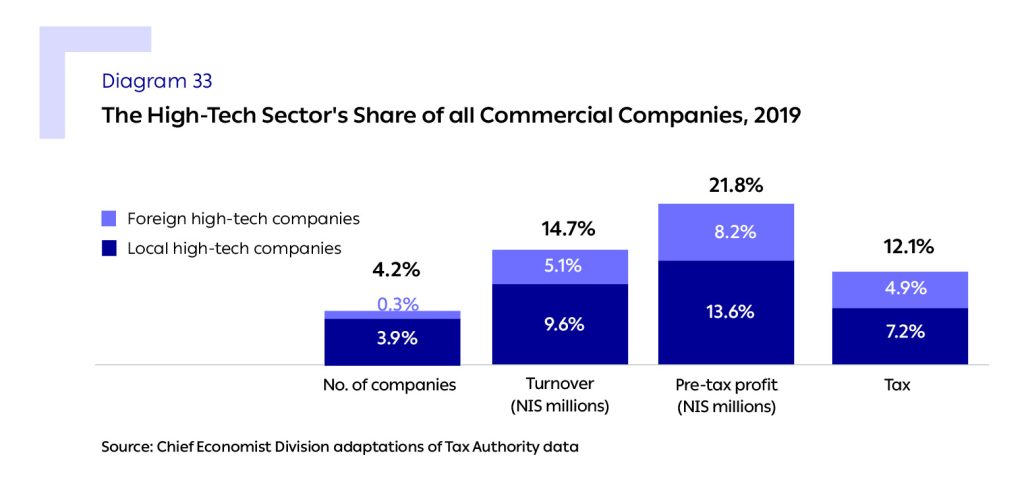
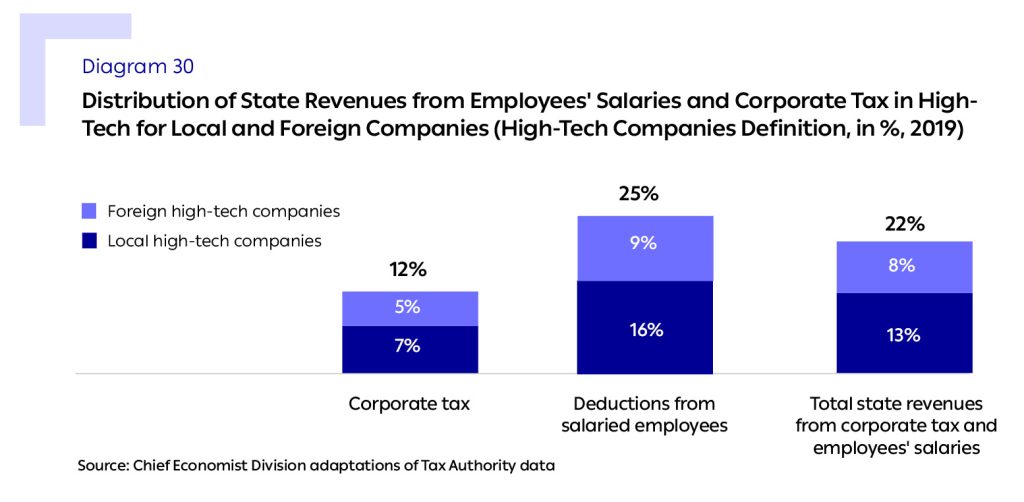
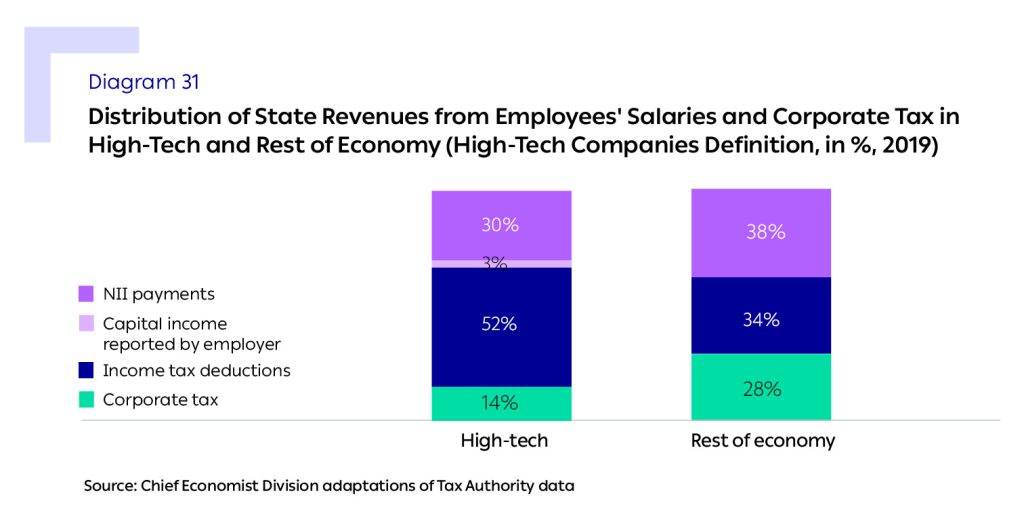
The total tax collected directly from the high-tech companies in 2019 was about 34 billion shekels, that constitutes approximately 22% of the economy’s total tax liability for corporate profits and individual income tax, and NII and health insurance payments from salaried employees.
In 2019 too, the major share of high-tech’s direct contribution to state revenues stemmed from taxation related directly to work. Revenues stemming from tax deducted from high-tech companies’ salaries constituted about 86% of the sector’s total tax liability with the remainder, 14%, being received from corporate tax.
High-Tech’s Share of Revenues According to State Revenues Categories (2019)
The salaried employees in the high-tech sector were responsible for about 25% of the income tax and NII payments made by all the economy’s salaried employees. In the income tax component, high-tech employees’ share stood at 30%, while their NII payments consisted of 18% of total NII payments by all the economy’s employees in 2019.
The average tax rate paid by the high-tech companies on their profits in 2019 stood at 12%, compared to the average tax rate of 21% paid by all companies. Consequently, the corporate tax liability of high-tech companies is lower than their relative share of total profits and totaled about NIS 4.9 billion in 2019 (12.3% of the total tax liability of commercial companies in 2019).